

SQR-089
Metrics for Phalanx applications#
Abstract
This technote describes solutions for collecting, storing, visualizing, and alerting on two different kinds of metrics for Phalanx applications:
Semantically-rich application metrics
Aggregated ephemeral operational metrics
Two kinds of metrics#
We want to track two kinds of metrics:
- Application metrics (app metrics)
How people are using the Rubin Science Platform (RSP)
- Operational metrics (ops metrics)
How the RSP applications are operating from a technical and infastructure perspective
An example of an application metric: how many times a given user has interacted with each RSP service. An example of an operational metric: how many times a Gafaelfawr pod has restarted unexpectedly.
There are many reasons to consider two different implemenations for these two different types of metrics:
Each type has different audiences. We shouldn’t make consumers of app metrics have to dig through a bunch of ops metrics to find what they need.
The source of data for each type of metrics is different. App metrics usually need to be measured in the app code itself. Ops metrics usually are usually measured from outside the app.
There are many out-of-the-box tools we can use to measure and record common ops metrics. App metrics are, by definition, custom to our apps.
Underlying data storage requirements are different. App metrics are often high-carinality, meaning they have attributes that could have tens or hundreds of thousands of possible values, such as username or an individual query id. Ops metrics don’t often have such high-cardinality attributes.
Data retention requirements are different. Ops metrics only need to be kept for weeks or months. App metrics need to be kept… forever.
These properties hold for most examples of each metric type, but not for all. Folks in some roles are insterested in both types of metrics. Some app metrics need to be measured from outside the app, and some ops metrics need to be measured from inside the app. There are some App metrics that aren’t high cardinality. But the properties hold enough to consider two different implementations.
Essential functionality#
For either type of metric, a solution needs to provide ways to do these things with the data we’re interested in:
Collect
Store
Query/Visualize
Alert
Ideally, provisioning of metric collection, dashboards, and alerts are all done with a GitOps-style strategy. Even more ideally, the resources to provision are declared in the Phalanx repo. None of these platform-provided solutions meet this goal completely, but some of them meet it partially.
App metrics#
Developers can use the Safir application metrics package to publish custom metrics. These metrics can be stored, visualized, and alerted on using Sasquatch infrastructure, which should be available in every Phalanx Kubernetes cluster.
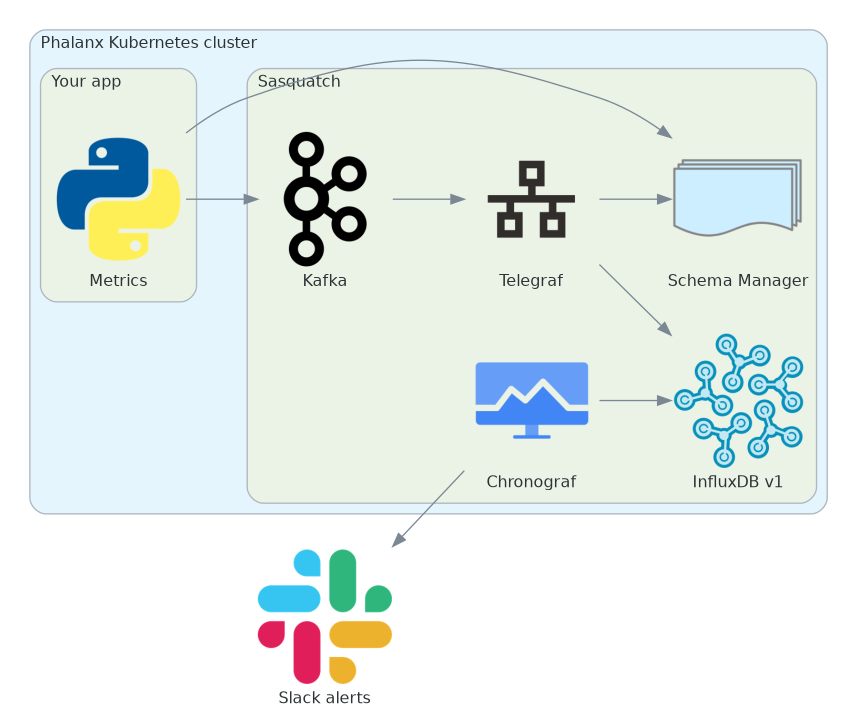
Collection#
Metrics events are defined and published in application code with the Safir application metrics package. During startup, apps use helpers from this package to create a Kafka topic (if it doesn’t already exists), and register Avro schemas for each event that the app will publish. While the app is running, it uses other helpers to serialize events and publish them to the Kafka topic. A Telegraf instance then takes from these topics and put them in an InfluxDB version 1 database.
Kafka, Telegraf, and InfluxDB are all managed in the Sasquatch Phalanx app.
Configuring metrics sending for an application for the first time is a somewhat heavy-weight process. An application developer needs to:
Then, the the app developer can instrument the app.
Avro vs JSON#
We initially chose to serialize events to Avro instead of JSON for two reasons:
We can prevent changes to the metric attributes that would make them either backwards or fowards incompatible (as defined by the schema registry compatibility types summary)
Avro-serialized messages take up less space in Kafka than JSON-serialized messages
We later decided that enforcing event schema compatibility was not important to us.
The Safir app metrics helpers set the compatibility mode of all schema registry subjectgs to NONE.
Now, the only reason we are using Avro instead of JSON serialization is for the lower storage requirements.
If we used JSON serialization, instrumented applications would not need to interact with the schema registry at all.
Storage#
We need a datastore that is able to:
Ingest metrics at a high rate
Query and group metrics by time range
Store and query metrics with high-cardinality attributes, like username (~10,000 values) or even TAP query id
Store metrics forever, or support a archiving strategy that lets us archive and restore large time periods of metrics
We chose InfluxDB v1, specifically the instance managed by Sasquatch.
We are already managing and operating it, for a volume of data much larger than app metrics. We already have backup/restore processes in place. We already have a resilient, multi-instance architecture.
It can handle high cardinality attributes like TAP query id, if we don’t index them (which we don’t need to). For attributes that we do need to index, username probably has the most distinct values. We expect ~10,000 users, and we expect InfluxDB to be able to handle this.
Query/Visualize#
We can use anything that can query InfluxDB to visualize and alert on app metrics data. Sasquatch already provides a Chronograf instance in every environment. We have been using this to create the charts and dashboards that we have needed so far. We are also rolling out Phalanx Grafana instances in the Phalanx clusters, though not every cluster has or will have one.
Alert#
We haven’t created any alerts on app metrics data yet, but we would probably use the Sasquatch-managed Kapacitor instance. Grafana could also be used for alerting in the clusters that have an instance.
Alternatives considered#
We considered using OpenTelemetry to instrument metrics for our apps, but we would have to use a different datastore than InfluxDB. While we can store OpenTelemetry data in InfluxDZB, some of the queries that we want to do are very difficult or impossible with InfluxQL. Histogram queries, for example, are not supported. All OpenTelemetry duration metrics are histograms. Queries over OpenTelemetriy counters are also difficult in InfluxDB.
If we want to use OpenTelemetry, a promising datastore is VictoriaMetrics.
Pros:
The database is optimized for HDD storage, making it inexpensive to retain a large amount of metrics (though not as inexpensive as object storage). Supposedly storage usage is more efficient than InfluxDB.
The compute and memory resources required to operate all components of the system are less than many other similar systems, like Prometheus, Mimir, Thanos, and even InfluxDB.
While still not a high-cardinality datastore, it can supposely handle higher-cardinality metrics than InfluxDB for the same compute/memory/storage.
We could provision alerts directly in the Phalanx repo using the official Kubernetes operator
There is a Helm mega-chart to provision the entire system that works and is well documented
It has a built-in way to take backups, like InfluxDB.
Cons:
It’s another database system to operate, which is a big effort
It doesn’t support un-indexed attributes, so we wouldn’t be able to record attributes like TAP query id
Direct Kafka integration requires an enterprise license, which is roughly equal in cost to the InfluxDB enterprise licenses that we currently have
Ops metrics#
We start with a simple strategy: get as far as we can with the platform-provided metrics services. The good thing is that we don’t have to maintain services and infrastructure ourselves (especially databases). The bad thing is that we need to learn how to use many different metrics systems.
USDF#
Phalanx Kubernetes clusters hosted at USDF are actually vClusters.
We work with metrics at the parent cluster level.
This leads to confusion because certain attributes are not what you expect them to be.
namespace, for example, is actually the vCluster name, not the Kubernetes namespace of the thing you’re interested in.
But we decided that this tradeoff was still better than maintaining our own ops metrics infrastructure in each of our USDF vClusters.
Metrics are collected and stored with a Prometheus-like system called Mimir.
Querying, visualization, and alerting are all handled by a Grafana instance at https://grafana.slac.stanford.edu. Querying has the previously mentioned caveats of confusing attribute values. Alerts are created manually through the Grafana web UI. Dashboards are created manually through the Grafana web UI.
Telescope and site#
Telescope and site clusters run Mimir for metrics collection and Grafana for visualization and alerting, at https://grafana.ls.lsst.org.
Google Cloud Platform#
Metrics are collected and stored with a combination of:
Dashboards and querying are done with Google Cloud’s dashboard UI and Google Cloud’s metrics explorer
Alerting is provisioned by Terraform in the Prodromos repository. These resources are not in the Phalanx repo because we don’t want to introduce a Terraform dependency to Phalanx, and there are no reliable ways to provision these resources using Kubernetes objects using Helm/Argo CD.
Alternatives we considered#
There are at least as many out-of-the-box Kubernetes ops metrics systems as there are grains of sand on Earth. Most of them are Prometheus-like, meaning:
They have collector services that periodically request metrics from HTTP endpoints exposed by exporter services.
The collectors discover the exporters using Kubernetes service discovery
The collectors put the metrics in some datastore
They provide web UIs to visualize the data and set up alerts, or delegate that functionality to a Grafana instance
VictoriaMetrics#
Of these, the most promising is VictoriaMetrics, with the same pros and cons as described in the ops metrics section. VictoriaMetrics could consolidate ops metrics configuration completely in Phalanx, and put app-specific alert and collection config with all other app-specific Phalanx config. Right now, ops metrics config is spread out across three repos:
idf_deploy for the managed Prometheus and metrics collection config
Phalanx for the manual metrics collection config
Prodromos for the alert config
Sasquatch#
We are already using Sasquatch InfluxDB infrastructure for our app metrics. We did try to use the InfluxDB (version 2) stack in our first attempt at an ops metrics system. It used Telegraf to ingest metrics from Prometheus exporters. But it had a lot of issues:
Generally, querying Prometheus metrics out of InfluxDB has the same issues as querying OpenTelemetry metrics
The Flux query language is difficult to use
Some of the queries over Prometheus metrics that we want to do are very difficult or impossible with Flux. Histogram queries, for example, are not officially supported. All duration metrics from Prometheus exporters are histograms.
Queries over Prometheus counters are difficult in InfluxDB versions 1 and 3, and queries over historgram metrics with those versions are impossible.
It was difficult to query the Prometheus data out of InfluxDB in a way that didn’t lead to duplicate alerts and delayed alerts.